Home > 2. Marine GIS > 2.23 Grid Extraction
2.23 General Methods to Extract Data Grids from GRIB, HDF and NetCDF
|
|
1. Using the above 3 programs (IDV, HDFView and Panoply) the user can extract the basic data grids from GRIB, HDF and NetCDF files. The methods shown below are:
In all cases, the user must examine the exported results for reasonableness and completeness. Not provided here is a method to extract a NetCDF grid from IDV; that technique is covered by Method 2 in Viewing and Managing Well-Formed NetCDF Grids in Saga. Saga can then be used to extract any one of dozens of raster/grid formats from a loaded NetCDF file. |
|
| 2. Method 1. Extract an Excel spreadsheet | |
|
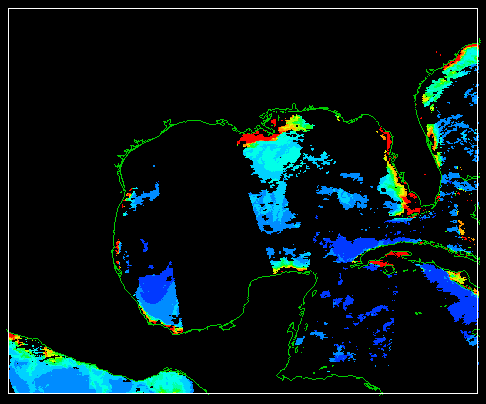
3. This is a typical marine grid in IDV. It could have come from GRIB, HDF or NetCDF.
A particular area of interest in the original global file has been selected with the PROPERTIES control. This is necessary to control the subsetting for the export. |
 |
| 4. On the IDV dashboard, select FIELD SELECTOR. Then select FORMULAS > EXPORT > EXPORT GRID TO EXCEL. |  |
|
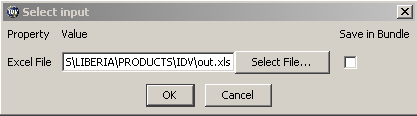
5. Use SELECT FILE to navigate to PRODUCTS > IDV and enter an appropriate filename. In this case the simple name out.xls was entered.
Uncheck SAVE IN BUNDLE. Then click OK. |
 |
|
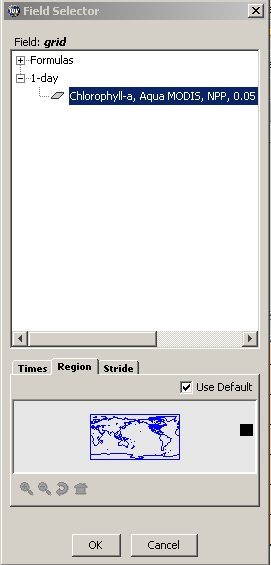
6. Now you have a final chance to subset the data. The REGION has already been set. Here you can select a TIME (if not already set), and STRIDE (if not already set).
For this test, we can just click OK. |
 |
| 7. IDV makes the new file out.xls, and it displays it on the map. Note that it looks exactly like the original, so the export is successful. | 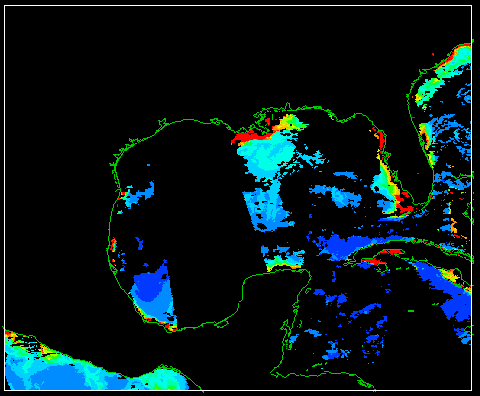 |
| 8. Just for your information, here's an example of striding, using the same original data. The stepping is by 10, so the data grid is only 1% as large as the original. | 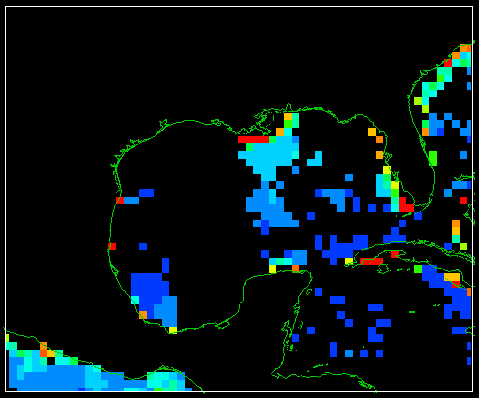 |
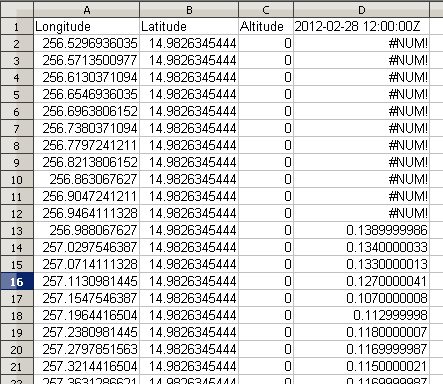
9. Open the file out.xls in a spreadsheet program to see its contents. It is a table with 4 columns.
Make sure to save the XLS file with a good long filename, in PRODUCTS > IDV |
 |
| 10. Method 2. Extract ASCII grids with HDFView | |
|
11. This is a chlorophyll data grid from the exercise Visualizing Satellite-Measured Optical Properties and Pigments in IDV: Giovanni. It's just a typical NetCDF marine grid.
[The data are shown here in the program ncBrowse, a good general viewer for NetCDF files.] |
 |
| 12. Run HDFView. | 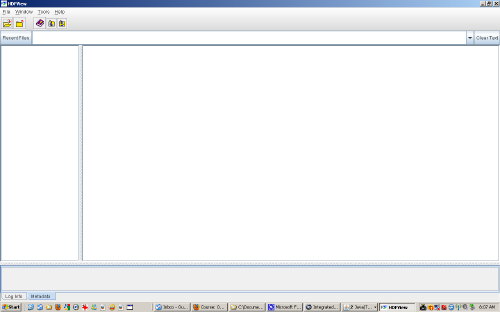 |
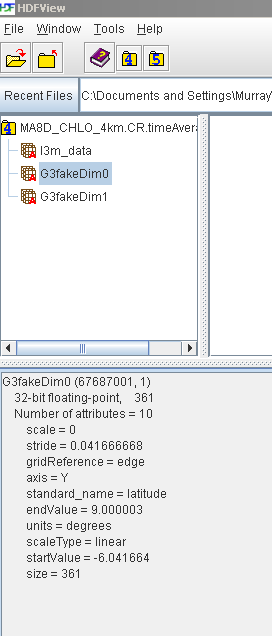
13. Here we've used FILE > OPEN to open the NetCDF file above. There are 3 panels:
NOTE: You must use FILES OF TYPE = ALL FILES to see and open NetCDF files |
 |
| 14. Select the actual data grid, L3M_DATA, and use OPEN AS to open it as a spreadsheet. |  |
| 15. Here's the spreadsheet. |  |
| 16. Select TOOLS > USER OPTIONS > DATA > DATA DELIMITER = SPACE > OK | |
| 17. Select TABLE > SHOW SCIENTIFIC NOTATION | |
| 18. Select TABLE > EXPORT DATA TO TEXT FILE | |
| 19. Navigate to PRODUCTS > HDFVIEW and write a good, long filename (e.g. MA8D_CHLO_4km.CR.timeAverage.0.txt in this case), with the extension TXT. Then click SAVE. | |
| 20. Here's the TXT file, in an ASCII editor. [If you have size problems with the TXT file, make sure to use ConTEXT or NOTEPAD++] | 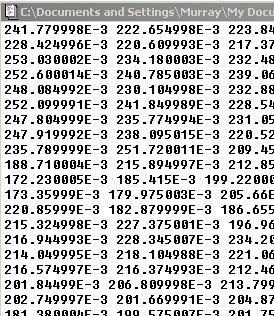 |
|
21. Here we've added 6 lines that constitute an ESRI Arc Grid ASCII header. The values 9999 are just place-holders.
You must do some research (see below) to find out what actual values to insert. |
 |
| 22. Look at the exercise 8.1 Importing Satellite Chlorophyll and SST Climatologies into Marine GIS: Color Web to see how to find and use the actual values needed above. The values are almost always located in the metadata for the data object (see Panel 13, above). The NODATA_VALUE comes either from the metadata or by inspection of the grid values. | |
|
23. The resulting edited ASCII grid file can now be loaded into almost any GIS program, as an ESRI ArcGrid ASCII file (specific names vary). The loading process is also demonstrated in the exercise cited just above. |
|
| 24. Method 3: Extract ASCII grid with Panoply | |
| 25. In this method, we'll use the same NetCDF file from above. | |
|
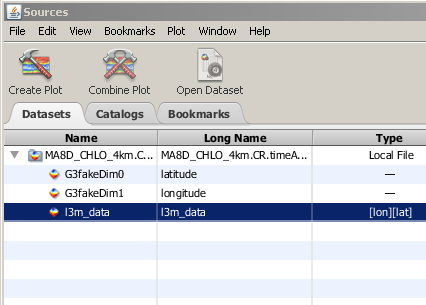
26. Run Panoply, and load the NetCDF file. You can see the same 3 data objects from the HDFView inspection above. Note especially that next to the L3M_DATA object, there is a notation [lon][lat]. This is very important, because Panoply cannot/will not work with object that lack this notation.
[Panoply opens somewhat strangely, in that it automatically takes you to the file navigation window.] |
 |
|
27. Double-click on the L3M_DATA object to open a map window.
Select VIEW > SIZE > SMALL to see the data map. It's not necessary for this exercise, but you can set PROJECTION = EQUIRECTANGULAR REGIONAL to center and size the map on Liberia. Numerous other settings are available, to be explored by you on your own time. |
 |
|
28. Back on the main window, select the L3M_DATA object, and select EXPORT LABELED TEXT. Click OK when you are ready to export.
[Note that 2 other export formats are also available. CDL is similar to the ESRI grids above, with a very much larger header. CSV stands for comma-separated values, and it is like the TXT export from HDFView.] |
 |
| 29. Navigate to PRODUCTS > PANOPLY and enter a filename like MA8D_CHLO_4km.CR.timeAverage.0_panoply.txt. Then click SAVE. | |
|
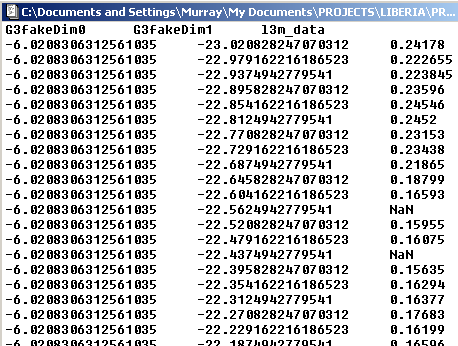
30. Here is the exported file, an ASCII table. Column 1 contains LATITUDE, and column 2 contains LONGITUDE.
This is the easiest possible way to convert projected data to other systems, because each data point is unabiguously associated with its own coordinates. Many workers use a filename extension of XYZ for this sort of file, for obvious reasons. |
 |
| 31. Here the data table above has been loaded into Saga and converted to a points shape (one step with Saga). You can see that the image processing algorithms in Saga make the best visualization. | 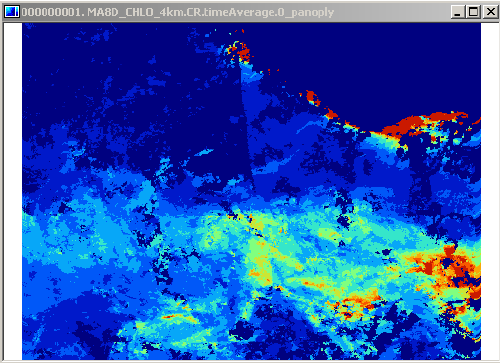 |
| 32. So now we have several methods to "get the data" from GRIB, HDF or NetCDF grids, which can be useful if you have your own analysis methods in mind. Make sure you save all products in the appropriate folders, with good, long filenames. | |